 Independent local guide
1. Fixed stake
Bet the same amount at every recorded opportunity. A larger cashout target reduces how often a payout occurs.
SPRIBE / AVIATOR / Nigeria
Compare ten betting rules, inspect the selected cashout settings and replay the same recorded rounds with your own virtual bankroll.
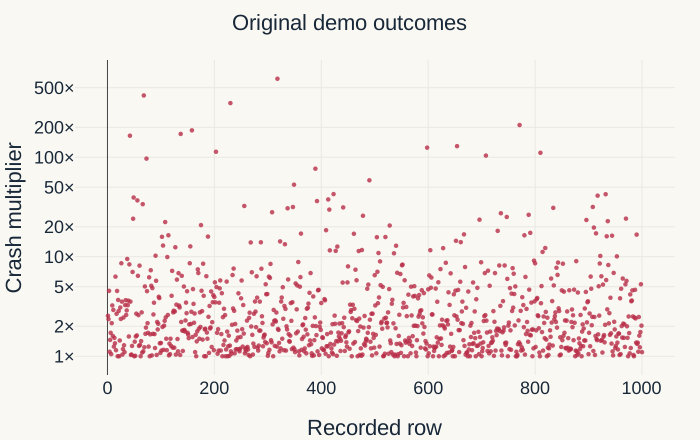
1,000 reconciled bets · 30 balance segments · 15–16 October 2026 · virtual funds
The original demo bets used virtual USD. Naira amounts below let you compare the same rules at familiar stake sizes; they are illustrative amounts, not a currency conversion or confirmed operator limits.
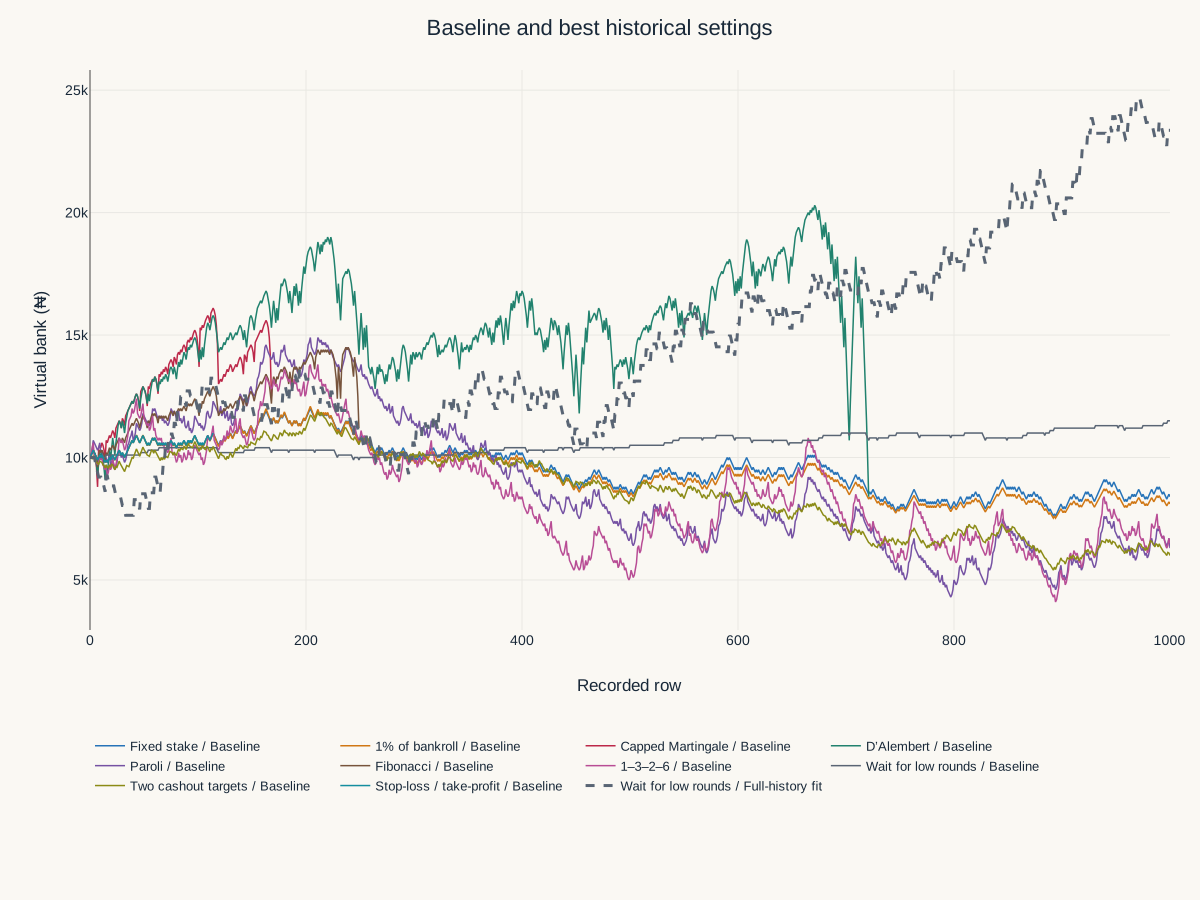
Baseline: ₦10,000 virtual bank, ₦100 base stake, ₦1,600 stake cap. Cashout 2× unless stated. Percentage staking uses 1% of the current bank; split stakes use 1.5× and 3×. Limits stop at −₦2,000 or +₦1,000. These are selected examples, not a popularity ranking.
| Strategy | Net (₦) | Maximum drawdown (₦) | Bets | Stop |
|---|---|---|---|---|
| Fixed stake | -1,600 | 4,400 | 1000 | End of selected rows |
| 1% of bankroll | -1,894.28 | 4,567.73 | 1000 | End of selected rows |
| Capped Martingale | +2,500 | 3,600 | 168 | Next stake exceeds cap |
| D’Alembert | -1,600 | 11,900 | 721 | Next stake exceeds cap |
| Paroli | -3,700 | 10,600 | 1000 | End of selected rows |
| Fibonacci | +1,200 | 3,300 | 249 | Next stake exceeds cap |
| 1–3–2–6 | -3,500 | 9,700 | 1000 | End of selected rows |
| Wait for low rounds | +1,500 | 500 | 117 | End of selected rows |
| Two cashout targets | -4,000 | 6,450 | 1000 | End of selected rows |
| Stop-loss / take-profit | +1,000 | 500 | 114 | Take-profit reached |
| Strategy | Net (₦) | Maximum drawdown (₦) | Bets | Stop |
|---|---|---|---|---|
| 1.2× | -3,760 | 4,280 | 1000 | End of selected rows |
| 1.5× | -2,800 | 4,550 | 1000 | End of selected rows |
| 2× | -1,600 | 4,400 | 1000 | End of selected rows |
| 3× | -5,200 | 8,400 | 1000 | End of selected rows |
| 5× | -7,000 | 11,000 | 1000 | End of selected rows |
Bet the same amount at every recorded opportunity. A larger cashout target reduces how often a payout occurs.
Stake 1% of the current virtual bank, rounded down to cents. After losses, the next stake shrinks; the percentage does not change the recorded outcomes.
Double the base stake after a loss; reset after a profitable bet. Stop before a stake exceeds the cap or available bank. Doubling below 2× does not necessarily recover earlier losses.
Increase by one base unit after a loss and decrease by one after a profit, never below one unit. This grows more slowly than doubling but still increases exposure.
Double after a profitable bet; reset after a loss or three consecutive profits. The simulation can change the number of winning steps.
Use stake units 1, 1, 2, 3, 5, 8… Move one place forward after a loss and two back after a profit, with a floor at the first unit. The cap still applies.
After consecutive profitable bets, stake 1, 3, 2 and 6 base units, then restart. Any losing bet resets the sequence.
Observe three outcomes at or below 2×, then bet on the next observed opportunity. Continue while the prior low sequence persists. It uses only past rows, and resets at a segment boundary.
Split the total stake equally between 1.5× and 3×. The two legs use the same crash outcome: they are not independent games. The displayed result combines both stakes.
Use a fixed stake, stopping after the virtual bank has lost ₦2,000 or gained ₦1,000. A stop is checked after settlement and can overshoot its threshold.
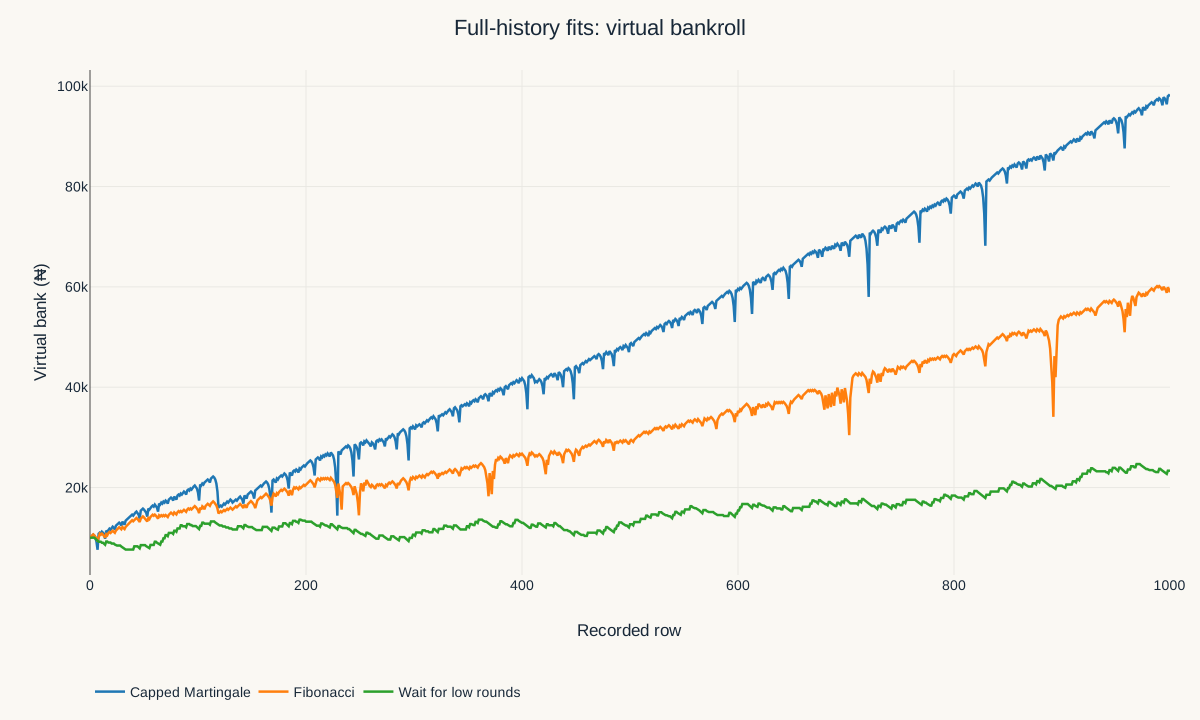
We expanded the search to 16,685 configurations and kept only runs that inspected all 1,000 rows without stopping early. 1,767 finished in profit; 70 were positive in all ten 100-row blocks. This search deliberately fits the whole known history.
The table shows the highest final net found for each rule, not the safest settings. Every replay starts with virtual ₦10,000. Segment boundaries reset progression, but the bank carries over. Large caps are arithmetic assumptions, not confirmed operator limits. The missing wagers and gaps can bias these results.
| Strategy | Best full-history settings | Net (₦) | Maximum drawdown (₦) | Bets | Positive 100-row blocks |
|---|---|---|---|---|---|
| Fixed stake | No profitable completed run in this grid | ||||
| 1% of bankroll | No profitable completed run in this grid | ||||
| Capped Martingale | target 2× · base ₦200 · cap ₦12800 | +88,000 | 12,600 | 1000 | 10 / 10 |
| D’Alembert | target 2.1× · base ₦50 · cap ₦1600 | +8,355 | 13,685 | 1000 | 5 / 10 |
| Paroli | target 1.6× · base ₦100 · cap ₦6400 · steps 5 | +10,220 | 10,180 | 1000 | 5 / 10 |
| Fibonacci | target 2.1× · base ₦200 · cap ₦12800 | +48,920 | 17,500 | 1000 | 10 / 10 |
| 1–3–2–6 | No profitable completed run in this grid | ||||
| Wait for low rounds | target 4.2× · base ₦200 · cap ₦12800 · wait 1 | +13,360 | 4,280 | 496 | 8 / 10 |
| Two cashout targets | No profitable completed run in this grid | ||||
| Stop-loss / take-profit | No profitable completed run in this grid | ||||
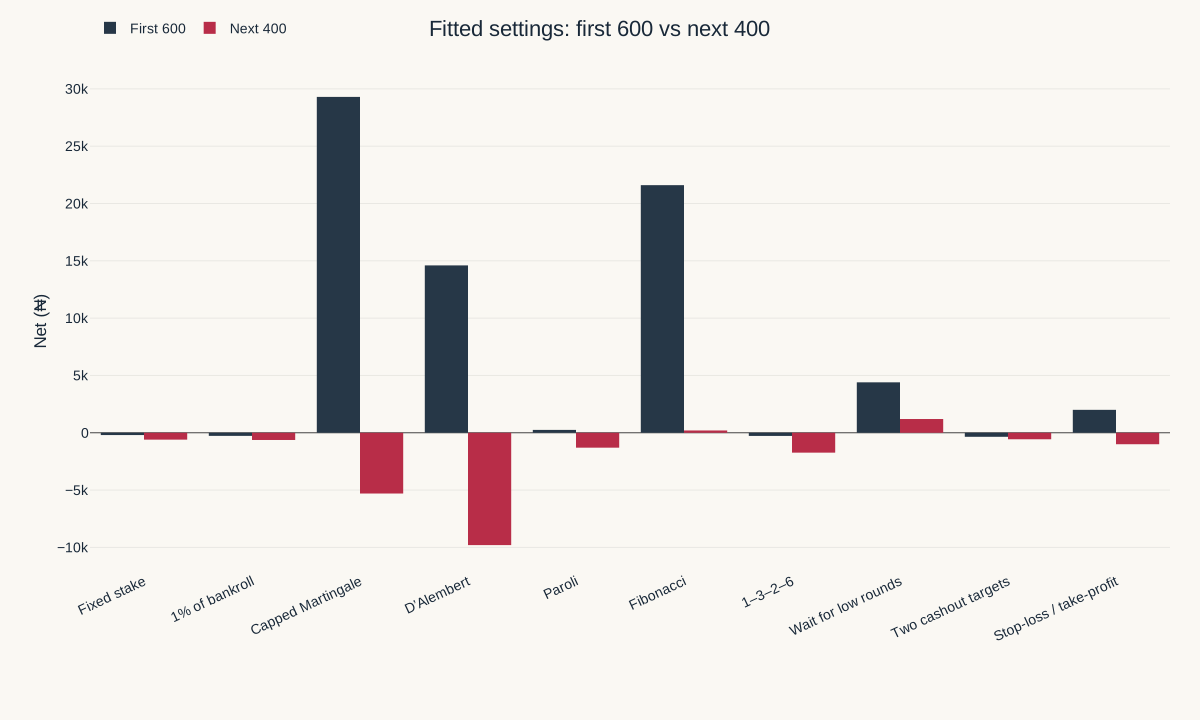
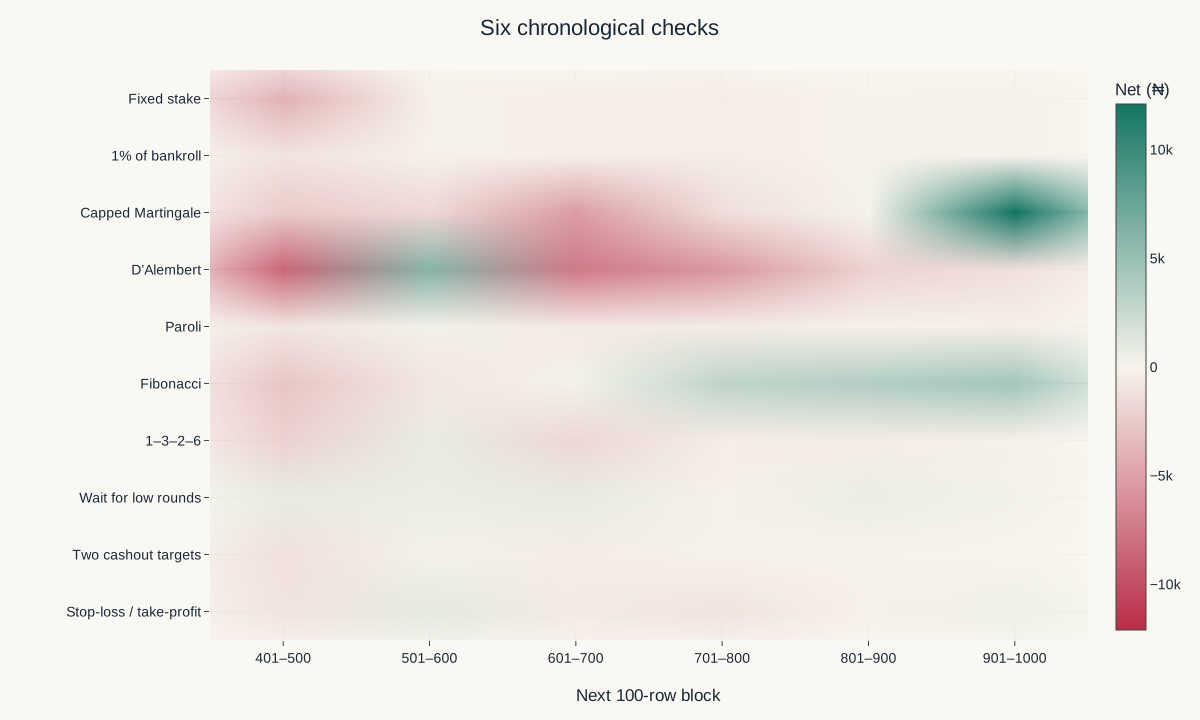
918 configurations were compared. Settings were selected on rows 1–600, then frozen for rows 601–1,000 with a fresh ₦10,000 bank. Selection score: (net − 0.5 × maximum drawdown) / 10,000, minus 0.25 for a cap or insufficient-funds stop. Six expanding-window checks each fit the preceding data and replay the next 100 rows.
The whole sample had already been inspected before choosing these rules and ranges. This is retrospective tuning, not a pristine unseen test. Multiple comparisons, missing outcomes and small betting subsets can make a lucky rule look effective. A positive block does not establish an edge.
| Strategy | Selected settings | First 600: net (₦) | Next 400: net (₦) | Next 400: bets / stop | Positive checks / 6 |
|---|---|---|---|---|---|
| Fixed stake | target 2× · base ₦50 · cap ₦800 | -200 600 Bets · End of selected rows | -600 | 400 / End of selected rows | 0 / 6 |
| 1% of bankroll | target 2× · base ₦100 · cap ₦1600 · 0.5% | -271.2 600 Bets · End of selected rows | -629.25 | 400 / End of selected rows | 0 / 6 |
| Capped Martingale | target 3× · base ₦100 · cap ₦3200 | +29,300 167 Bets · Next stake exceeds cap | -5,300 | 12 / Next stake exceeds cap | 2 / 6 |
| D’Alembert | target 2× · base ₦200 · cap ₦3200 | +14,600 600 Bets · End of selected rows | -9,800 | 101 / Insufficient bank | 1 / 6 |
| Paroli | target 2× · base ₦50 · cap ₦800 · steps 2 | +250 600 Bets · End of selected rows | -1,300 | 400 / End of selected rows | 1 / 6 |
| Fibonacci | target 2.5× · base ₦200 · cap ₦1600 | +21,600 229 Bets · Next stake exceeds cap | +200 | 31 / Next stake exceeds cap | 4 / 6 |
| 1–3–2–6 | target 1.7× · base ₦50 · cap ₦800 | -275 600 Bets · End of selected rows | -1,735 | 400 / End of selected rows | 1 / 6 |
| Wait for low rounds | target 3× · base ₦200 · cap ₦3200 · wait 4 | +4,400 29 Bets · End of selected rows | +1,200 | 21 / End of selected rows | 5 / 6 |
| Two cashout targets | target 1.7× · base ₦50 · cap ₦800 · second 2× | -352.5 600 Bets · End of selected rows | -567.5 | 400 / End of selected rows | 2 / 6 |
| Stop-loss / take-profit | target 2× · base ₦100 · cap ₦1600 · loss stop ₦1000 · profit stop ₦2000 | +2,000 204 Bets · Take-profit reached | -1,000 | 120 / Stop-loss reached | 2 / 6 |
This is a historical calculator, not a live game or predictor. It submits no bets. The same input gives the same result. Apply a baseline or fitted preset, then change the controls.
Left to right is the recorded row number. Up and down is the virtual money left. Every coloured line is a different rule, starting with ₦10,000. A rising line gains money; a falling line loses it. The fall from a previous peak is the drawdown, even if the line is still above its starting bank.
Every included row matches an original accepted and settled wager, with its balance equation checked. The data contains 30 separate balance segments. There were 29 unresolved accepted wagers in the preceding collection attempts; they are excluded, and their missing outcomes may bias these results. The ten pilot rounds are excluded. This is not an uninterrupted sequence of every public game round.
Replay pays only when the crash is strictly greater than the target. Equality is treated as a loss because timing at the boundary was not established. Payouts round down to cents. Progression, waiting signals and loss streaks reset at every segment boundary; the hypothetical bank carries over. Actual demo return is 97.2% for this sample, not theoretical RTP.
Maximum drawdown is the largest fall from an earlier bankroll peak, not simply the final loss. A high peak can make drawdown larger than the opening bank. Profit, turnover and number of bets must be read together.
CSV and JSON contain anonymised observed rows. The analysis JSON includes assumptions and all baseline results; tuning JSON contains the grid, frozen settings and six checks. No account tokens or raw network traffic are published.
node aviator-ng-tuning-script.mjs
SHA-256 · d7990719c10081e673d4c632038ff8e4524156d503fddce9fc3e29448c31d005
Analysis: 16 October 2026 · SPRIBE Aviator · Sources you can check yourself.
No result here demonstrates one. This is a finite, interrupted demo sample, and fitting settings after seeing data creates selection bias.
This replay tests a rule using past observations. A positive result on selected rows does not prove the next round becomes more predictable.
No. The source bets used virtual USD in the official demo. Naira figures are a hypothetical replay for this guide.